6.1: Processes
One of the three core tasks of an OS is the management of tasks. These different tasks are all running on the same processor. To make this magic happen some form of management is required.
What’s in a process ?

By definition, a process is an instance of a program. As was dicussed in the “C-portion” of this course, a basic program can be divided in multiple segments. When source code is compiled into a binary, these segments are fixed.
- text/code: is the machine code in assembly. This section is compiled for one (type of) processor(s).
- data: is the segment that contains initialised variables. These variables could be global, static, or external. A further distinction can be made between normal initialised variables and constants. This distinction is often referred to with read-only (ro-data) and read-write (rw-data), with the former the part where the constants reside and the latter that of the normal variables.
- bss: (Block Starting Symbol) this segment contains the global and static variables that are not initialised.
- stack: dynamic part of memory used to store typically short-lived data. See Chapter 8
- heap: dynamic part of memory used to store typically longer-lived data. See Chapter 8
Let’s put these definitions to the test. A very simple program could be written as follows:
#include <stdio.h>

int main(void) {

  printf("hello world !\n");

  return 0;
}
As you know by now, this program can be compiled with the command below:
jvliegen@localhost:~/$ gcc -o hello hello.c

jvliegen@localhost:~/$
On the CLI there is a command size that can be used to examine these segments.
jvliegen@localhost:~/$ size -B hello
   text    data     bss     dec     hex filename
   1516     600       8    2124     84c hello
jvliegen@localhost:~/$
This command shows the sizes of the sections that are discussed above. The text, data and bss sections are 1516, 600, and 8 bytes. In total this sums up to 2124 bytes, which can be written hexadecimally as 0x84C.
OK, this makes sense :)
Run process !
By the time you’re reading this part of the course, running the binary that was compiled above should be a walk in the park.
jvliegen@localhost:~/$ ./hello
hello world !

jvliegen@localhost:~/$
When a program is started, an instance of the program is created, which we now call a process. The program’s executable file on disk typically contains only the text, bss and data segments (and not exactly those, it’s a bit more complicated, as we’ll see later). The Stack and the Heap are assigned by the OS when creating the process of the program. The OS is thus responsible for copying the program’s code into memory (as we’ve seen in Chapter 2, Assembly code instructions are also just “numbers” in memory) and allocating (or at least reserving) additional room for the stack and the heap. How this is done concretely will be discussed in chapter 9.
So now the program was loaded into the memory. But to actually run it as a process, we need to keep some additional state for each instance. This state is kept in the Process Control Block (PCB), which is created and stored in the kernel upon mapping an instance of the program in memory.
Process Control Block
The Process Control Block (PCB) is a representation of the process in the OS. It is created as a task_struct object. Such a PCB is made for every process and the definition of its struct is in the kernel source.
HOLD ON Linux is an open source OS, so does that mean we should be able to find this struct in the source code ?
WELL YES Inspecting the sched.h file verifies:
- that we can read the source code
- that the task_struct is indeed there,
- that the PCB has a lot of parameters. The definition of the struct starts at line 737 and ends at line 1546 for Linux kernel release 6.1. As might be clear from this code (or even from thinking about the number of lines of codes), this struct is rather large. A (very) small subset of the fields in the struct represent:
- the process state (see below)
- the process identifier (PID), a unique number
- the process priority (see Chapter 7, scheduling)
- CPU scheduling info (see Chapter 7, scheduling)
- list of open files
- memory limits
- the CPU register contents (containing things like the stack pointer, local variables, return addres, etc. see end of Chapter 3)
- the program counter (PC)
Especially these last two parts are crucial: they store the actual execution state of the program at a given time. The PC points to the current instruction the CPU will execute. As such, you can already see how it becomes easy to for example pause a process for a while: simply stop updating the PC.
The PCBs of all the processes are contained in a doubly-linked list data structure in the kernel, which is headed by the mother of all processes. This process is called init and has PID 0. The doubly-linked list is commonly known as the process table.
Let’s verify all of the above. To do that, we need to keep a process running for long enough to determine its PID and read other information. For this, we’ll adapt our “hello world” C program so it takes much more time to run:
#include <stdio.h>
#include <unistd.h>

#define DURATION_IN_MINUTES 2

int main(void) {
  int i;

  for(i=0;i<(DURATION_IN_MINUTES*60);i++) {
    printf("hello world !\n");
    sleep(1);
  }

  return 0;
}
After starting the program, the PID of the ./longhello process can now be looked for using the ps command (“Process Status”). The -u flag lists only the processes started by the current user. Use -aux to get a list of all processes. Use ps -u | grep longhello to get info on only this specific process.
jvliegen@localhost:~/$ ps -u
USER       PID %CPU %MEM    VSZ   RSS TTY      STAT START   TIME COMMAND
jvliegen 14339  0.0  0.0  30408  5500 pts/3    Ss   09:57   0:00 bash
jvliegen 20162  0.0  0.0   4504   804 pts/1    S+   11:49   0:00 ./longhello
jvliegen 20244  3.0  0.0  47232  3616 pts/3    R+   11:51   0:00 ps -u
jvliegen 27675  0.0  0.0  30544  5556 pts/0    Ss+  08:55   0:00 bash
jvliegen 27700  0.2  0.5 207400 96300 pts/0    Sl   08:55   0:30 /usr/local/bin/
jvliegen 29414  0.0  0.0  30412  5504 pts/1    Ss   09:13   0:00 bash

...
In the example above the PID is 20162. Now we want to get some information on this process. Remember how we said that in Linux, almost everything is a file? Well, while this process is running, Linux magically creates a folder in the /proc map that has the same name as the PID. There is a lot of metadata on the process that can be consulted here. For example, certain fields in the struct_task are reflected in this folder.
jvliegen@localhost:~/$ ls /proc/20162
attr             exe        mounts         projid_map    status
autogroup        fd         mountstats     root          syscall
auxv             fdinfo     net            sched         task
cgroup           gid_map    ns             schedstat     timers
clear_refs       io         numa_maps      sessionid     timerslack_ns
cmdline          limits     oom_adj        setgroups     uid_map
comm             loginuid   oom_score      smaps         wchan
coredump_filter  map_files  oom_score_adj  smaps_rollup
cpuset           maps       pagemap        stack
cwd              mem        patch_state    stat
environ          mountinfo  personality    statm
Let’s try to execute some commands here and see what they do:
- ls -al /proc/20162/cwd
- cat /proc/20162/sched
- cat /proc/20162/status
- cat /proc/20162/limits
- ls -al /proc/20162/net
(tip: the cat command (short for concatenate) can be used to read a file and display its contents.)
Process state
One of the fields in the PCB is the process state. This value can be set to any of these values:
- New The process is being created
- Ready The process is waiting to be assigned to a processor
- Running Instructions are being executed
- Waiting The process is waiting for some event to occur (such as an I/O completion or reception of a signal)
- Terminated The process has finished execution
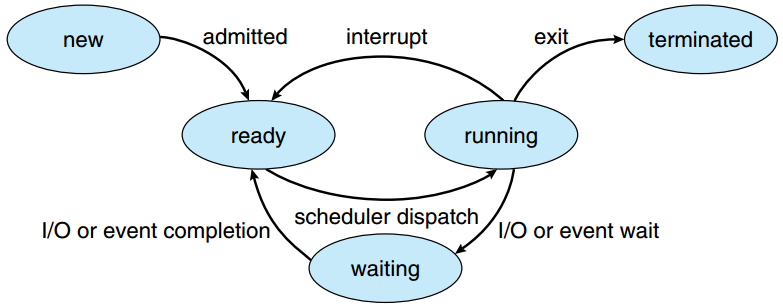
The different process states and their transitions
source: SILBERSCHATZ, A., GALVIN, P.B., and GAGNE, G. Operating System Concepts. 9th ed. Hoboken: Wiley, 2013.
In practice, a process will (very) frequently switch between the Ready/Running/Waiting states in a normal execution. This is because a single CPU can run many processes “at the same time”. However, this is not really at the same time! What actually happens is that the CPU runs process A for a little while, pauses it (goes to Ready state), runs process B for a little while (goes to Running state), pauses it, runs process C for a little while, etc. We will see how this works in more detail in Chapter 7.
Open files list
Every process that is created has a list of open files. Even programs that do not actually work with files have this list, and it is never empty. Typically three files are open by default:
- standard input (stdin)
- standard output (stdout)
- standard error (stderr)
As you might have understood by now, these are not -actual- files on your hard disk. This is again some Linux magic, where input/output logic is represented as files, to make them easy to read/write from.
For example, by default, stdin is mapped to the keyboard and both stdout and stderr are mapped to the command line. These mappings can be altered and redirected, however. For example, we might want to send errors (stderr) to a file instead. Redirecting can be done and will be briefly touched in section 6.5.
Creating processes
In Linux there are two typical ways for users to create processes: using fork() or exec(). There is a third option using a system() function, but because it is less secure and less efficient then the other two, it is not discussed here. Both fork and exec create a new process, but in very different ways.
The fork function copies the PCB and the entire memory space (including stack and heap!) of its current process to a new PCB and memory location. The process that calls the fork() is referred to as the parent process, while the new process is its child. The child process will continue operations on the same line as the parent process (because of the copying of the PCB, the program counter is also copied!). This method is useful if you want to for example process a lot of data on multiple processors: you first get everything ready, then fork() new child processes that each deal with a part of the data. This is easier than manually starting new processes from scratch.
The exec function in contrast doesn’t really spawn a new process, but instead replaces itself entirely with a new program. It starts by replacing its internal ‘program’ (read the text, data, and bss) with the new program to be executed. It then clears all its heap and stack memory and starts executing the new program from the first instruction (reset PC). Note that the new program can be a copy of the current one (essentially “starting over”), but more typically it’s an entirely new program. The main way in which Linux starts new processes is to first fork() the current process, and then to call exec() directly inside of the new fork’ed clone, replacing it with the intended new program.
It is mentioned earlier that the first process that is started is the init process. When the complete OS starts, the init process spawns a lot of other processes. There are processes that handle connecting to the network, processes that do logging, and so on. Using the pstree command we can see the processes in a tree, and have a visual representation of which child-parent relations exist between processes.
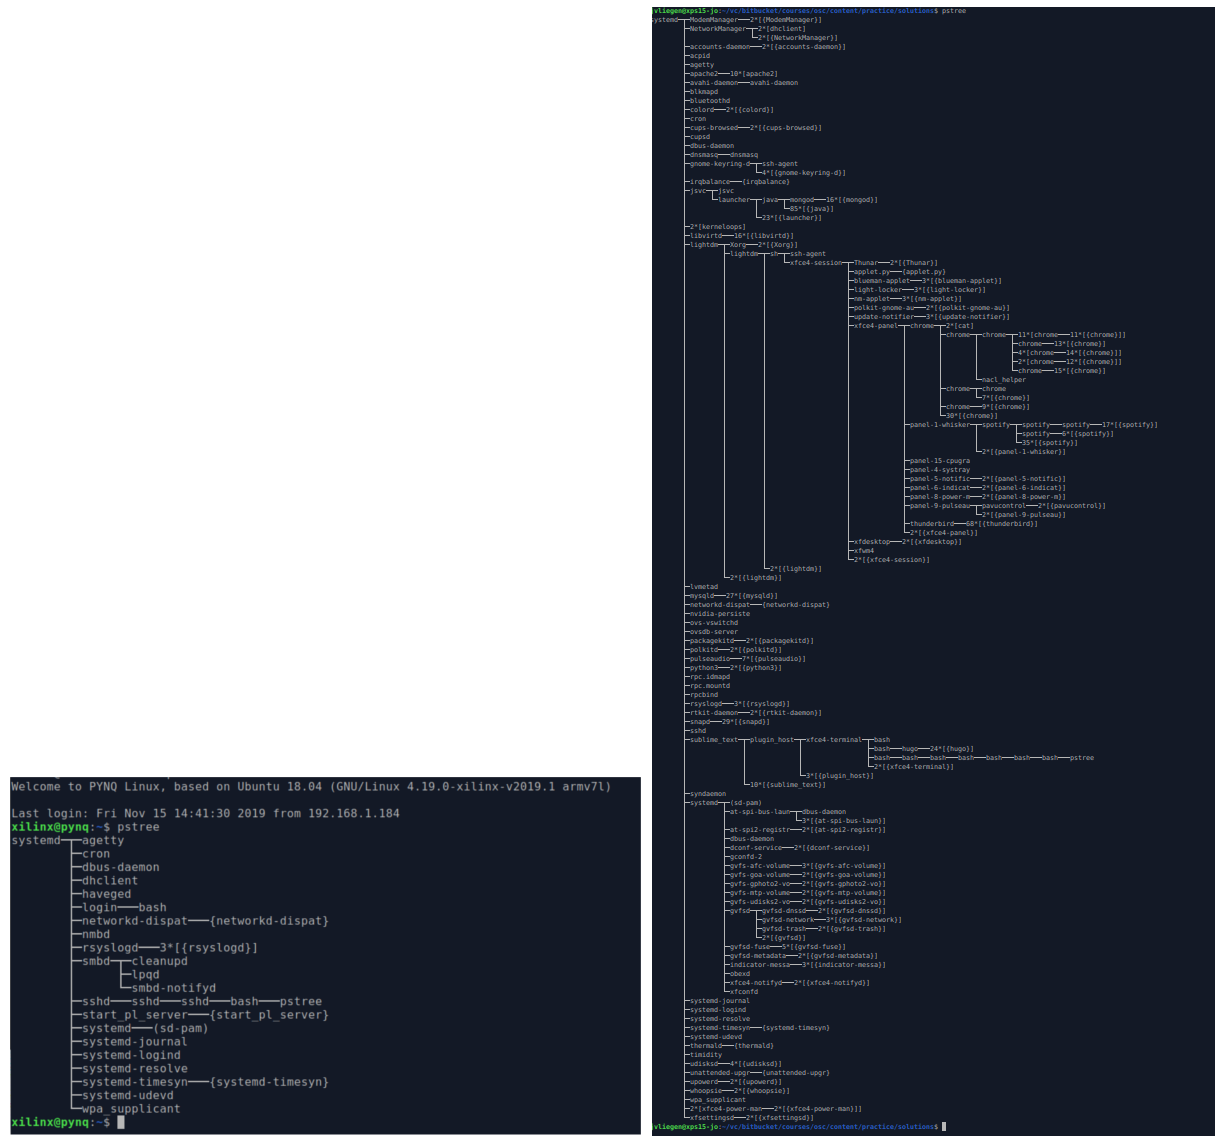
An example of the pstree command. The left image shows the result of Linux on an embedded system. The right image shows the result of Linux running on a laptop
When you start a new process from your command line (say ./longhello), how is that started internally do you think?
Verify your hunch by using the ps -efj command and looking at the PPID column (“Process Parent ID”).
Alternatively, you can also use the pstree -hp command.