5.1: The Easy Way: IDEs
1. The easy way: Debugging using an IDE
Arguably one of the better integrated C/C++ IDEs out there is CLion, a toolkit from Jetbrains based on the IDEA platform you all know from IntelliJ. It has exactly the same tools and capabilities but is fully geared towards C and C++. Cross-compiling and toolchain setup is also very easy using CLion. The Figure below is a screen capture of CLion showcasing it’s integrated unit testing capabilities which we will expand upon in the coming sections.
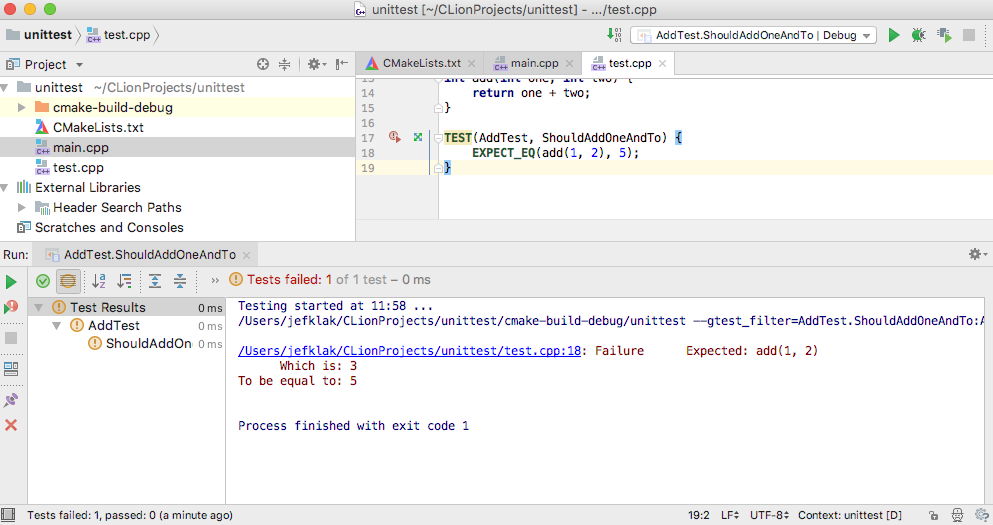
A quick glance at the screenshot reveals the following buttons:
- Play: Compile and Run
- Debug
- Attach to process
- Run tests (step through, …)
- File management window
- Gutter with line numbers and possibility to add breakpoints
- …
A short live demo of CLion’s debugging capabilities is in order here.
CLion is not free but a 30-day trail is, and as a student you can apply for a one-year license for free using your student e-mail address. Bigger development environments like this are typically used when developing large applications with a lot of source and header files. In this course, we will not be needing that. That is why the usage of a tool like this is not needed for now.
Instead of relying on visual debug tools like CLion, another ‘hard-core’ commandline alternative exists for Linux: gdb (The GNU debug tool).