5.2: The Hard Way: GDB
2. The hard way: Command-line debugging using GDB
In order to fluently debug binary programs, they have to be compiled with the debug flag, gcc -g. This will add metadata to the binary file that gdb uses when disassembling and setting breakpoints. IDEs automatically add metadata like this when you press the “Debug” button on them, but since this is a command-line application, we need to do everything ourselves.
2.1 With debug flags
Let’s start with a heap-based application we would like to inspect:
#include <stdio.h>
#include <stdlib.h>
#include <unistd.h>
#include <string.h>

char password[] = "250382";

int main(int argc, char *argv[])
{
  int stackvar = 5;
  char *buf = (char *)malloc(100);
  char *secret = (char *)malloc(100);

  strcpy(secret, password);

  printf("Crackme! \n");
  printf("Password? ");

  scanf("%s", buf);

  if (!strcmp(buf, secret)) {
    printf("Password OK :)\n");
  } else {
    printf("Invalid Password! %s\n", buf);
  }

  return 0;
}
If the source code would not have been supplied, making an estimated guess against the password would take a (very) long time. (We naively assume here that the program has been compiled with debug information enabled).
Compile using gcc -g hackme.c. Take a look at the filesize - without flag:
wouter@wouter-Latitude-7490:~/Development$ gcc hackme.c -o hackme.bin && ls -la | grep hackme.bin
-rwxr-xr-x  1 wouter wouter 8568 Jan  7 19:59 hackme.bin
With flag:
wouter@wouter-Latitude-7490:~/Development$ gcc hackme.c -g -o hackme.bin && ls -la | grep hackme.bin
-rwxr-xr-x  1 wouter wouter 11352 Jan  7 19:59 hackme.bin
Star the gdb debugger using gdb [binary]. It will enter the interactive gdb shell, where you can set breakpoints, step through code, and have a chance at inspecting the heap, where we might attempt to figure out what’s hidden in there.
Things you need to know from the GDB debugger:
r: running the program (main() method execution)c: continue after a breakpointi: inspect (i r [regname]: inspect register name)startandnext(shorthandn) orstep: start stepping through the application.b *[addr]: set breakpoint at certain function/line/*address (see manual). Conditionals are possible, for instance:break func if arg == 3.delete: deletes all breakpointsdisassemble [fn]: disassembles functionname (after running)x/[length][format] [address expr]: inspect dynamic memory block (see manual)print x(shorthand:p): printvar, or&varaddress (Enalbe printing of addresses:show print address)info(shorthand:i) address/line (fn) orsource
Bootstrap gdb and step through the whole application. As soon as the stackvar has been evaluated, try to inspect the memory value using x/d. The address expression could be hexadecimal, or &stackvar.
How could you evaluate a heap variable using the x command? If you have the address, how do you pry out the value on the heap?
More useful commands:
- Don’t remember which breakpoints you’ve set?
i b. (info breakpoints) - Don’t remember where you’re at now? Inspect the stack:
bt(backtrace), optionally appended withfullthat includes local variables. - Don’t know which registers to inspect?
i r(see manual).
Can you spot the stack pointer and program counter? Can you see what happens to them when a function is called or an instruction is executed? Why do you think the PC doens’t simply increment with the expected four bytes when instructing gdb to execute a line of code?
Do not forget that the expression that is printed out is the one to be evaluated after you enter the ‘next’ command. You can already inspect the stack variable address but it will contain junk:
(gdb) start
Temporary breakpoint 1 at 0x7d9: file hackme.c, line 11.
Starting program: /home/wouter/Development/hackme.bin

Temporary breakpoint 1, main (argc=1, argv=0x7fffffffdd68) at hackme.c:11
11    int stack = 5;
(gdb) x/d &stack
0x7fffffffdc6c: 21845
(gdb) next
12    char *buf = (char *)malloc(100);
(gdb) x/d &stack
0x7fffffffdc6c: 5
Address 0x7fffffffdc6c first contains 21845 - a coincidence that might have another value on your machine.
Bootstrap gdb, disassemble the main function, and set breakpoints after each malloc() call using b *[address]. You can check the return value, stored at the register eax, with i r eax.
How come something interesting is hidden in eax after calling malloc()?
- Because
eaxis the return value register, or the accumulator. You should be familiar with it due to other Hardware-oriented courses. - Because malloc returns a void pointer - read the
manpages carefully!
2.2 Without debug flags
Now try to ‘hack’ the password using gdb without the -g compiler flag. Imagine someone has put up a binary file on the internet and you managed to download it. No source code available, and no debug information compiled in. The gdb tool still works, disassembling still works, but method information is withheld. That means calling start and next will not reveal much-needed information about each statement, and we will have to figure it out ourselves by looking at the disassembly information.
Try to disassemble again and look at the heap value of our secret. Notice that you will not be able to use something like x [varname] because of the lack of debug information! We will have to rely on breakpoints of address values from the disassembly.
Remember to always run the program first before disassembling - otherwise address values will be way too low, and thus incorrect. bt does noet help us either here: No symbol table info available.
When inspecting the return value of eax, gdb returns a relative address for our current program (8 BITS), while we need an absolute one (16 BITS) when using the x command to inspect the heap. Look at the disassembly info to prepend the right bits:
---Typeto continue, or q to quit--- 0x0000555555554844 <+122>: mov -0x8(%rbp),%rdx 0x0000555555554848 <+126>: mov -0x10(%rbp),%rax 0x000055555555484c <+130>: mov %rdx,%rsi ... (gdb) b *0x00005555555547ea Breakpoint 1 at 0x5555555547ea (gdb) r Starting program: /home/wouter/Development/osc-labs/solutions/debugging/a.out Breakpoint 1, 0x00005555555547ea in main () (gdb) i r eax eax 0x55756260 1433756256 (gdb) x 0x55756260 0x55756260: Cannot access memory at address 0x55756260 (gdb) x 0x0000555555756260 0x555555756260: 0x00000000
As you can see, 0x55756260 is an invalid memory address, but based on the disassembly info, we can deduce it is actually 0x0000555555756260 we need to look at.
There’s another way to pry out the return value of the last statement. The finish command executes until the current stack is popped off (that is, the function ends) and prints the return value. Set a breakpoint to just below malloc(), call finish, and the result is:
(gdb) finish
Run till exit from #0  __GI___libc_malloc (bytes=100) at ./malloc/malloc.c:3294
0x0000aaaaaaaa08f4 in main ()
Value returned is $1 = (void *) 0xaaaaaaab22a0
There’s your address you can now inspect using r 0xaaaaaaab22a0. It’ll likely still be 0x00000000, so try to step and inspect until it contains the value you’re interested in.
Remember that finish here works because we breaked inside malloc(), which then becomes the current stack. If you’re still debugging in main, an error will appear, as there is nothing to finish: popping the stack would end the program.
Registers are platform- and architecture-specific! In other words, the return value register eax is only available on x86_64 CPUs. If you’re on a modern Mac with an ARM64, you’ll have to check info all-registers and consult the ARM Developer Documentation to find the correct register.
The pc and sp registers are universal concepts.
The (still) hard way: DDD, a UI on top of GDB
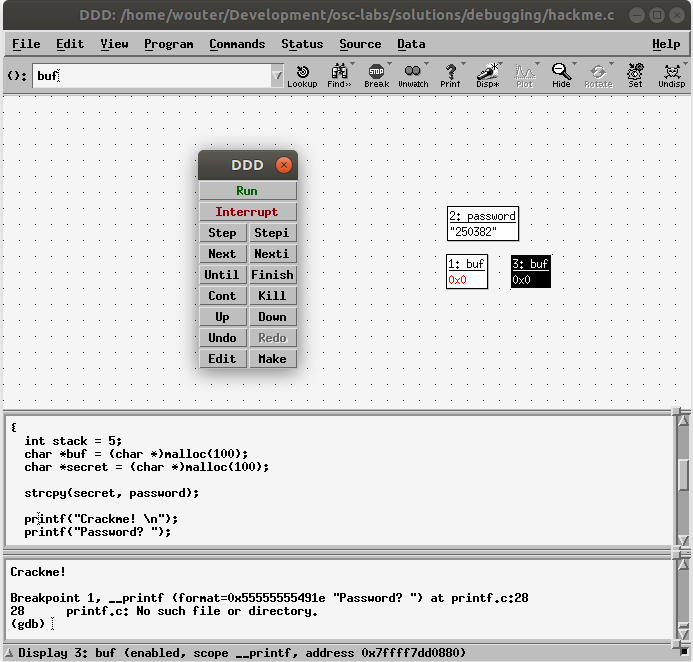
Instead of invoking gdb, one can also employ ddd. This is a crude UI on top of the gdb debugger, with multiple windows where the same commands can be entered as you have learned so far. However, ddd also allows you to visualize heap/stack variables while stepping through the application. The Figure below shows a screen-shot of a debug session of our hackme app using ddd.
Things to try out:
- Display the Source Window via the View menu. This window lets you set breakpoints and interact with the source code.
- Display the Machine Code Window via the View menu. This window is the equivalent of
bt(backtrace) ingdb. - Right-click on a line in source (compile with
-gagain!) -> Add breakpoint - Start/step using the buttons or the commands in the cmdline window.
- Right-click in the main window -> “New Display” to add variables by name to watch (for instance
bufandpassword, as shown). You can also watch references to functions - any validgdb-style expression will do.
Take a moment to fiddle with ddd after correctly installing it. Try to inspect the same heap variable as the previous exercises, but this time visualize them in the main window. It should be (slightly) easier to accomplish.